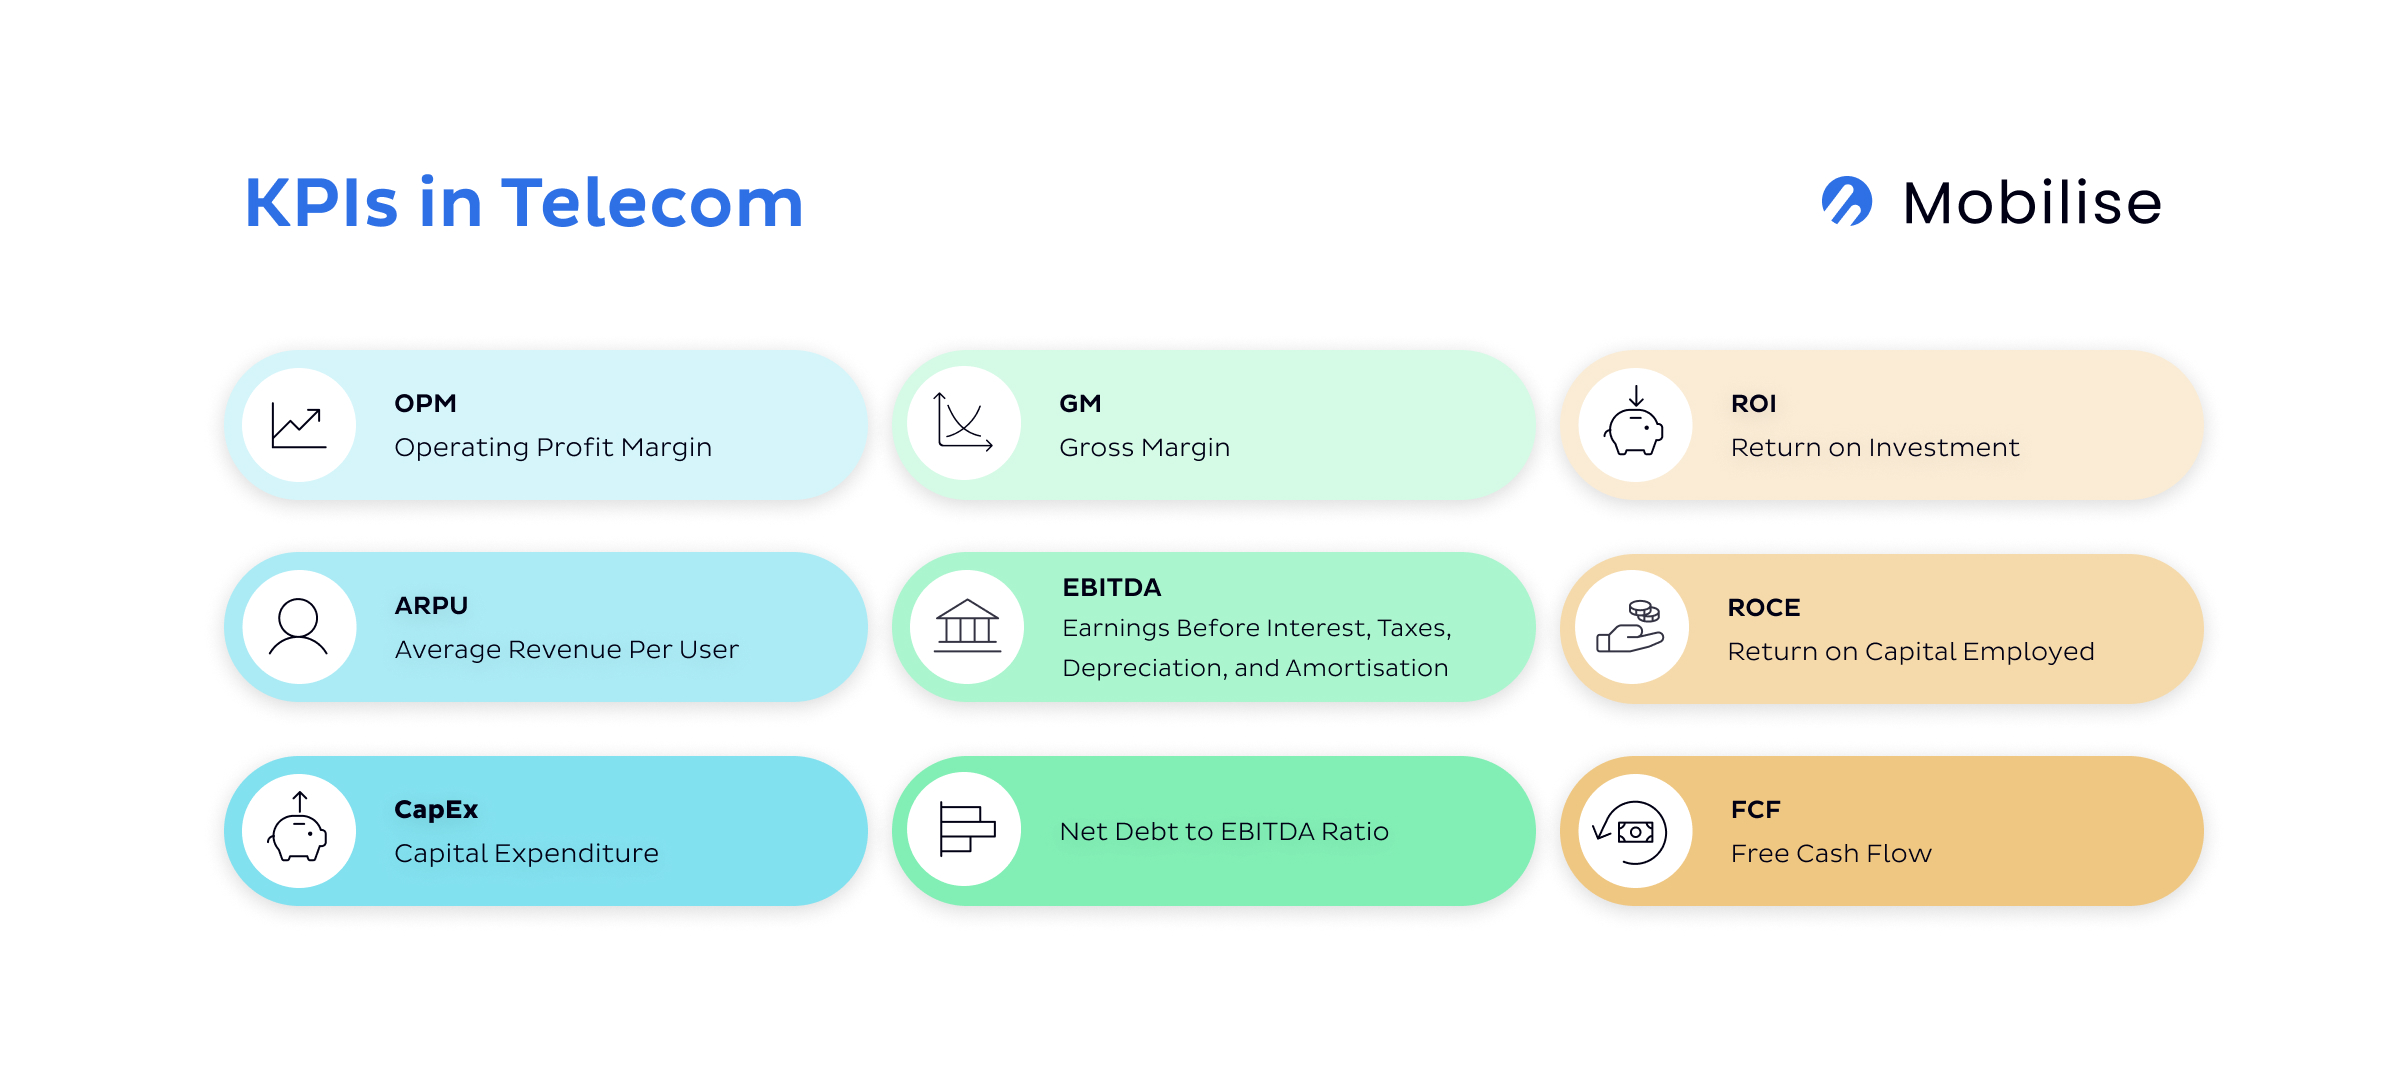
In an increasingly challenging telecoms landscape, where financial performance seems to be a main concern, we see more and more news about certain KPIs. Not least where every second article on LinkedIn discusses the economic woes facing mobile operators (or at least in my feed!). What do all these KPI in telecom actually mean? Navigating the financial landscape of the telecom industry demands a robust understanding of Key Performance Indicators (KPIs). These metrics serve as a compass, guiding organisations towards their financial goals.
Let’s dive into a detailed analysis of several well-known financial KPIs in the telecom industry. Shedding some light on what they mean. Below, I’ve underpinned each with real-world examples.
KPI in telecom

Operating Profit Margin (OPM)
This profitability indicator calculates the percentage of revenue left after deducting operational costs. For instance, if a telecom company has total revenues of $500 million and operational costs of $350 million, its OPM is 30%. This metric is indicative of the company’s efficiency in controlling costs and its pricing strategy.
Average Revenue Per User (ARPU)
ARPU measures the revenue generated per subscriber. If a telecom company has 1 million subscribers and generates $50 million in a quarter, the ARPU for that quarter is $50. Monitoring ARPU helps the company to strategise its pricing and marketing efforts for maximum revenue.
Capital Expenditure (CapEx)
CapEx represents the funds used for acquiring or maintaining physical assets. For instance, a telecom company investing $200 million in upgrading its network infrastructure to support 5G connectivity is a CapEx. This investment is crucial for maintaining competitiveness and enhancing customer experience.
Gross Margin (GM)
One of my favourites, GM, also known as gross profit margin, is a key profitability metric. One that represents the percentage of total revenue that exceeds the cost of goods sold (COGS). It is calculated by subtracting COGS from total revenue and then dividing that number by total revenue. For a telco, the “cost of goods sold” would generally refer to the direct costs attributable to the provision of its services. This might include costs related to network maintenance, cost of sales for devices, interconnection charges (the charges paid to other companies for delivering calls on their network), and direct labour costs. Let’s take a hypothetical example. If a mobile operator generates $1 billion in revenue in a given period and the cost of goods sold (such as network maintenance, device costs, interconnection charges, etc.) during the same period is $400 million, the gross margin would be calculated as follows:
Gross Margin = ($1 billion – $400 million) / $1 billion * 100% = 60%
This means that for every dollar the company makes in sales, it has 60 cents left over to cover basic operating costs and profit. This is a critical metric as it indicates how efficiently a company is using its resources and supplies in the production process. A higher gross margin ratio is generally favourable. Indicating that the company operates more efficiently in terms of producing its goods or services.
Earnings Before Interest, Taxes, Depreciation, and Amortisation (EBITDA)
This metric reflects a company’s operational profitability. Suppose a telecom company reports an EBITDA of $300 million. This figure, when compared to its peers, provides insight into the company’s operational efficiency and profitability concerning industry standards.
Net Debt to EBITDA Ratio
Particularly relevant in the capital-intensive telco industry. This KPI measures a company’s leverage and its ability to repay debt. A telecom company with a net debt of $500 million and an EBITDA of $250 million would have a Net Debt to EBITDA ratio of 2. A lower ratio may indicate a better financial position and a higher capacity to service its debts.
Return on Investment (ROI)
ROI evaluates the efficiency of an investment. If a telecom company invests $100 million in a new marketing campaign and generates an additional $150 million in revenue, the ROI is 50%. This metric is vital for assessing the effectiveness of investments and informing future decision-making.
Return on Capital Employed (ROCE)
ROCE is the metric we hear more and more about. It is a profitability ratio, indicating how efficiently a company is using its capital to generate profits. Higher ROCE values generally point to more efficient usage of capital. Let’s see how this KPI fits into the broader telecom financial landscape with a real-world example. If a telecom company has an EBIT (Earnings Before Interest and Taxes) of $300 million and its total capital employed (sum of shareholders’ equity and debt) is $1 billion, the ROCE would be 30%. This suggests that for every dollar of capital employed, the company generated 30 cents of profit. ROCE can help telecom companies compare the profitability across their investment options. Thus, informing their capital allocation decisions. With the large investments required for new generations of networks such as 5G, the evolution of a mobile operator’s ROCE per year can show how increasingly challenging it is to generate profit from investments.
Free Cash Flow (FCF)
FCF is a measure of the cash a company generates after accounting for cash outflows to support operations and maintain its capital assets. It is an important measure because it allows a company to pursue opportunities that enhance shareholder value. Let’s see how these fit into our broader telecom financial landscape:
If a telecom company generates $500 million in cash from its operations and spends $200 million on capital expenditure, its FCF would be $300 million. This remaining cash can be used to pay dividends, buy back stock, or invest in new opportunities without relying on external financing. Telecom companies with strong FCF have greater flexibility and are better positioned to drive shareholder value.
Vodafone’s story
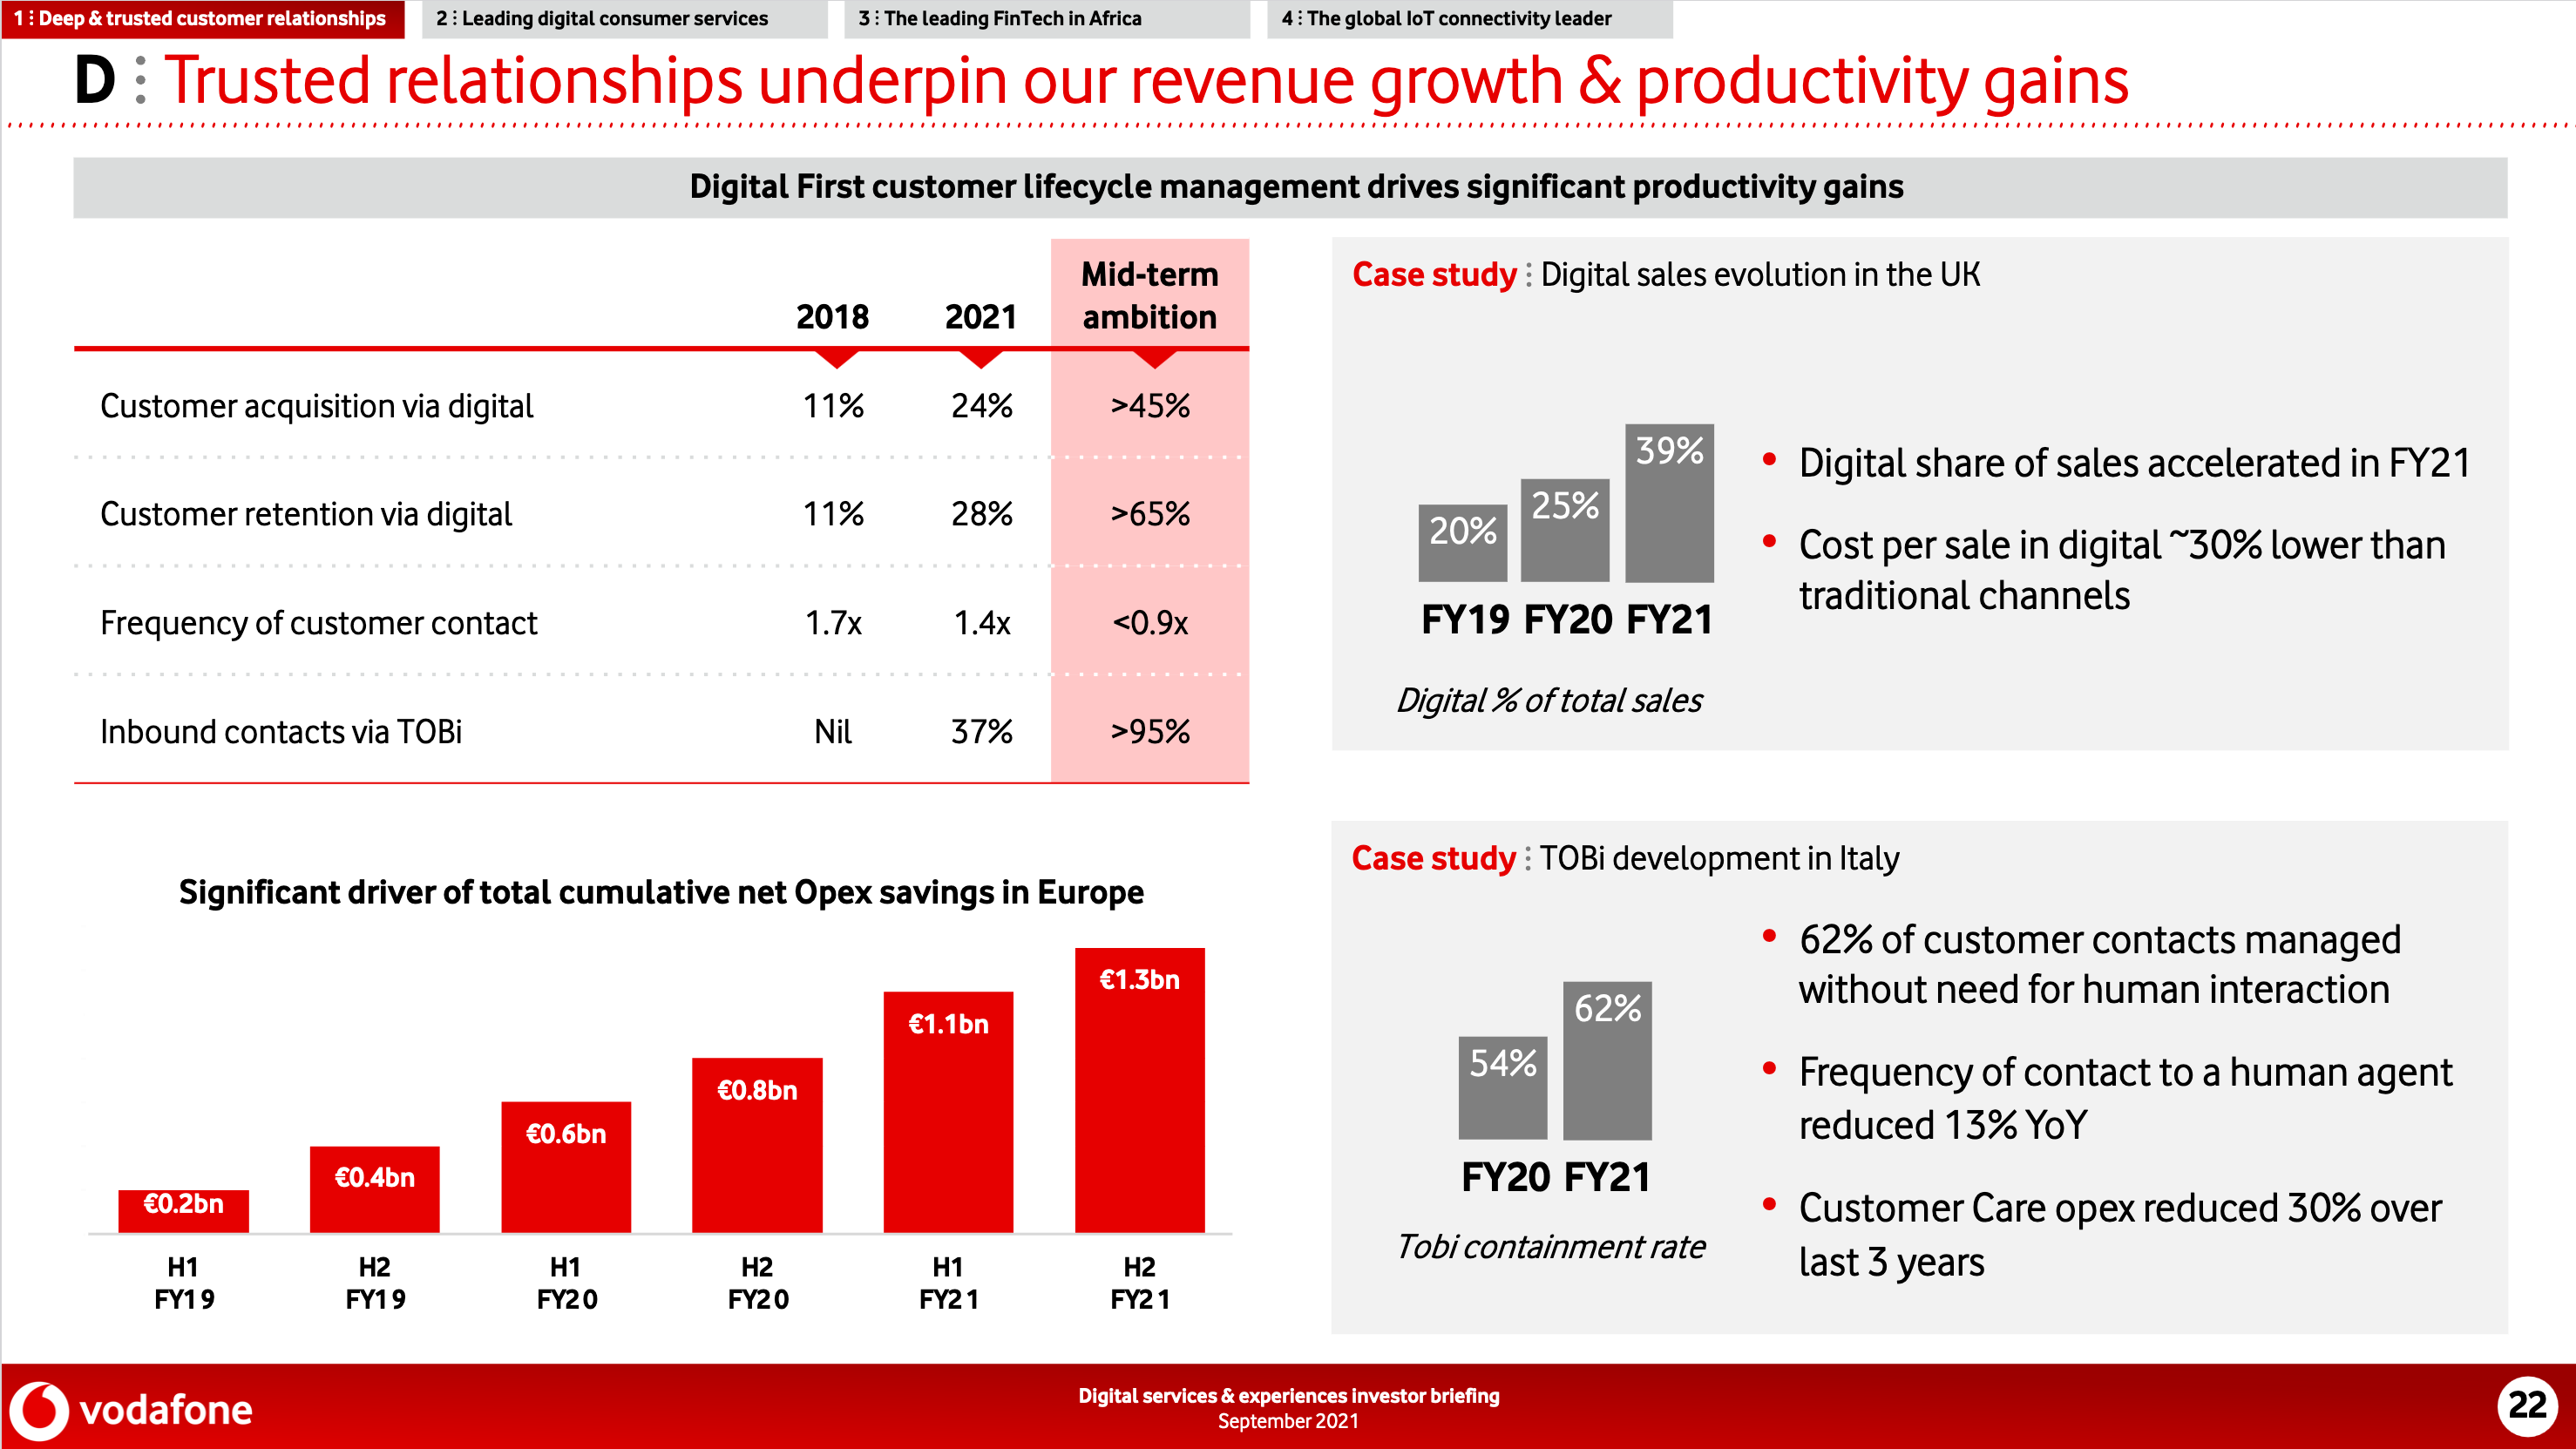
Digital-first service propositions, the kind that our HERO platform helps telcos deliver, are being proven to provide considerable cost savings and operational efficiencies and increase customer lifetime value through improved customer experiences and greater loyalty. Don’t take our word for it. Vodafone recently shared a detailed analysis of the benefits they have achieved, including:
- The cost per sale in digital is ~30% lower than in traditional channels.
- Customer care OpEx reduced by 30% over the last 3 years.
- Total cumulative OpEx savings of 1.3b euros.
 Source: Vodafone
Vodafone is one example of the financial efficiencies that a telco can deliver through Digital-first service propositions. Without a doubt, there is a growing body of evidence to suggest that digital-first propositions are delivering solid ROIs. Helping telcos mitigate some of the financial impacts they’ve witnessed in recent years. Of course, provided your digital strategy is executed well!
Our opinion on KPI in telecom
Which financial KPIs do you believe are paramount for telecom companies to track?
Hamish White: Personally, I would like to see more on the Revenue per Employee metric as a KPI in telecom. Digital organisations, such as many within the tech field, will report on Revenue per Employee. In the context of telcos focusing more and more on digital-first service propositions, Revenue per Employee would seem a logical metric to gauge efficiency. So what is Revenue per Employee? It is a measure of a company’s operational efficiency. It divides total revenue by the current number of employees, helping to quantify how effectively a company utilises human capital. Let’s see how this fits into our broader telecom financial landscape:
Revenue per Employee: If a telecom company generates $1 billion in revenue and has 5,000 employees, the Revenue per Employee would be $200,000. This metric helps assess a company’s efficiency in generating revenue from its workforce. A higher figure can indicate better utilisation of human resources or a more streamlined operation.
Collective input is vital to this professional discourse, and we look forward to your valuable insights. In our upcoming blog post, we will delve into your responses, dissecting these KPIs based on your feedback.
Conclusion
KPI in telecoms and the general financial landscape of the industry can be tricky to navigate. Remember, in the complex world of telecommunications, understanding and analysing financial KPIs can lead the way towards sustainable success. On top of this, digital-first propositions are delivering solid ROIs. Helping telcos mitigate some of the financial impacts they’ve witnessed in recent years. Refusing to keep up with advancements could prove to be detrimental to success.


